

 |
|
|
|
|
||
| SIGN IN | VIDEO LIBRARY | PRICES | REVIEWS | CONTACT |
| Analysis of results for Mathematics |
|
Statistical analysis of 32 results
What is provided below is a justification of our claim that our results demonstrate a significant improvement in the performance in Mathematics of our intial cohort of 32 students. We establish a basis for comparison after which we apply a standard statistical test and draw a conclusion. The conclusion is expressed as a probability: the probability that the improvement of these students at Black's Academy is a mere fluke is a number so small that we cannot calculate it. It is a number less than one in one trillion. This massively beats all accepted criteria in scientific research. In the soft sciences a probability of 5% (one in twenty) is often taken to be significant. Hence, we justify our claim that the improvement is proven. We can also support this conclusion analytically. We are aware of what the improvements in methodology that we have implemented are, and what practices in existing educational provision limit the actualisation of the potential of students rather than realise that potential. We have made a revolutionary improvement in teaching methodology. |
||
|
Theory of brain plasticity
We subscribe to the theory of brain plasticity and seek to conduct further research in support of this theory. |
||
|
||
|
Statistical analysis in detail
We establish a method of comparing the results at Black's Academy with the predictions provided by the standard models. Profiling of Mathematical attainment at blacksacademy.net is based on a single number called, the profile score. Correlation with GCSE grades is obtained by matching school reports, CAT scores and actually obtained GCSE results. Students are correlated by evidence, which may be seen in the preceding page. These correlations establish that our profile score is a predictor of GCSE attainment. The correlations given in the preceding page also demonstrate the performance improvements in our students. Our students really do improve at school and school assessments establish this. Profiling is also supported analytically. We have a detailed map of the Mathematical curriculum concept-by-concept, skill-by-skill for GCSE grades 2 to 9. We have broken that curriculum down into approximately 2000 separate steps. We know precisely what our students have covered in terms of that hierarchy of concepts and skills and hence can predict analytically a student's GCSE performance. |
||
 |
||
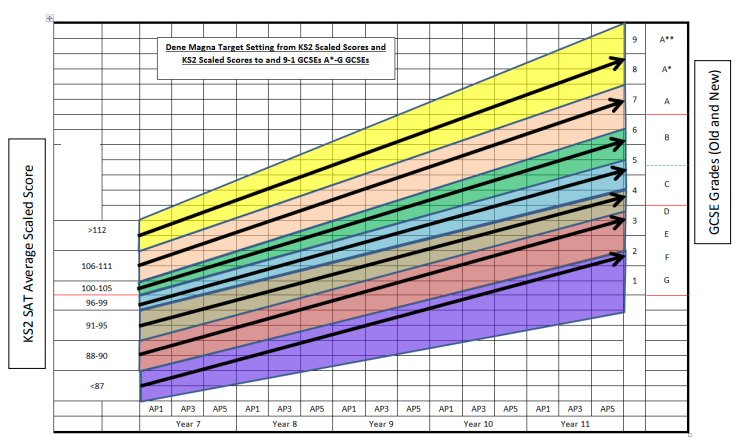
| Clearly, there will be some degree of variance between actual attainment and the line shown in the above diagram. However, this is not really an issue here, as what we are seeking is merely to correlate attainment as predicted by the standard models with the number we use (our profile score) in our analysis. The whole point of the standard models is that they are used to predict outcomes, and hence, students for whom such predictions are made can only progress in their profile score by a finite number. That is the same for our students too, only the progress with our methods is a number significantly larger than that which could possibly be provided by any student which has in fact already been assessed by a standard model and included in one of their data sets. | ||
 |
||
| From the above diagram you can see that on a standard model a student who scores 100 in a test in year 7 is predicted to attain grade 5 at GCSE in Year 11. These correlate to our profile score equivalents of 340 and 530 points respectively, or an improvement over five years of 190 points. Hence, 38 points per year. | ||
| The chart illustrated above is a replica of one published by a reputable school on their website. You can see this for yourself by visiting this standard model. The school has been graded "outstanding" by Ofsted. | ||
 |
||
| The above is an example of a prediction based on a CAT score sent to an actual parent. This is disturbing for parents. They are told that on the basis of a test taken by their child in Year 6 that it is highly unlikely that their child will ever attain anything more than GCSE grade 2 in Mathematics five or six years later and browbeaten into believing it with statistics based on vast numbers of assessments. | ||
| It would be objective to use the improvement of +38 profile score points per year of work to calculate the improvement the students in our cohort could have been expected to make if they were not studying with us. However, in fact we take the figure of +70 per year of work as the basis of the calculation, which is generous. We lose nothing by this exaggeration of the expected improvements of a student reliant upon the "system" independently of their study with us. However, it is worth pointing out that this "system" does involve any number of other providers of tuition, since it is not likely that some of the students whose performances are included in the large data sets of the providers of standard models have not also been tutored independently of the classroom. Parents have been seeking remedial education from outside sources for some time. | ||
| We also estimate a year's work in a school at 125 hours per year. This is based on an academic year of 35 weeks and an average of 3.5 hours of Mathematics lessons per week. This gives 122.5 hours, which we have rounded to 125 hours per academic year. Hence, a student who takes 125 hours of coaching with us would benefit by an academic year's improvement if the same number of hours were undertaken in a school, which correlates to +70 points in our profile score. | ||
| Another reason for the +70 profile points per year is that these students are usually attending a school, and it could be argued that the school is also improving the student. Thus, we compensate for any improvement that the school is making to the student by estimating the students' performance were they receiving no tuition by Black's Academy at +70 points per academic year of 125 hours. | ||
| In summary, we estimate that a student at school would improve by +70 profile points for every 125 hours of teaching. | ||
| Therefore, we arrive at the following table of direct comparisons between our results and the results that can be predicted for like number of hours of teaching by the "system". | ||
 |
||
| We can now apply a standard statistical test to calculate the probability that our data is different from the equivalent data obtained from a standard model. The test we have appplied is the paired t-test for the difference of the mean. We inputted the two columns of related data into a online statistical package and obtained the result that our mean improvement was 14.5 standard deviations greater than the mean improvement of the data that would be obtained from the standard model. | ||
 |
||
| Even four standard deviations equates to a probability of less than 3 in 1 million. A result of 14 standard deviations equates to a probability significantly less than 1 in a trillion. | ||
| It remains to be seen whether "experts" will find reasons to pick over and dispute the analysis of our results provided by the above method. One thinks that it would be an extremely cynical undertaking, but science must proceed on the basis of openness to criticism, and we welcome it. | ||
 |
||
| You only have to look at how our students' results cut across the white lines provided by the standard models representing their 90% and 95% confidence intervals to see that there is a case to answer. And for any parent or educator that should be sufficient reason to expect like improvements for their child or student. Let us open up the question of what are the best methods to debate. This will benefit students. | ||